Detecting Human Walking Motion
Using OpenCV
|
Goal The goal of my project was to detect human walking motion, specifically gait, from a sequence of images, by looking at the periodicity of the movement. |
|
Techniques Motion History The main techniques and series of functions used are from the motion analysis and object tracking set of OpenCV tools. Specifically, UpdateMotionHistory, ClacMotionGradient, CalcGlobal Orientation, and SegmentMotion. These provided the information on the moving regions, i.e., what areas are moving, and what is the angle of each movement. Filter / Predictor The second technique needed was a way to predict the next motion, based on the centroids represented (explained below), in order to differentiate between walking motion and non-walking motion, thus detecting human motion. Two different methods were tried. The first method was the Kalman estimator, which proved to be unsuccessful after close examination of the example code provided with the OpenCV toolkit. The problem was that the estimator did not perform very well. A working Kalman estimator should improve over time, however in this case, the best performance was at the beginning of the program's execution. By this I mean that the position of the predicted motion (indicated by a green '+') was closest to the actual motion (indicated by a red '+') only at the very beginning. As the program continued to run, the predicted motion symbol moved farther and farther away from the actual motion symbol. This signifies that the estimator's accuracy decreased over time. The second, and successful method was the Alpha-Beta-Gamma (abg) filter. This filter works by measuring the object, then predicting the motion by adding values for velocity and acceleration, providing a trajectory of the motion. |
|
Implementation This section lists and explains the steps necessary to achieve the goal. The source code can be found here.
|
|
Parameter Modifications The parameters that were changed / modified to elicit results that (theoretically) can be reproduced for any sequence of images are:
|
|
Analysis and Results An analysis of the data after executing the program shows that the gait of human walking motion indeed, can be detected, based on the periodicity represented by plotting (with gnuplot) the 'x' coordinate for both the measured target and the predicted target. When launching the program, 3 windows appear, which are represented by the images below. 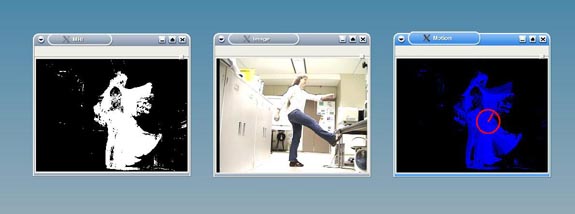 The image on the left shows the motion history. The center image is the actual image, and the image on the right contains the information about the moving regions. |
| The moving regions are segmented out and depicted by the centroids, which are the red circles with the lines. The red lines in the circles show the angle and direction (from the center outward) of the movement of each region. The number of centroids is equal to the number of detected moving regions. Pressing the "Enter" key over and over causes the program to advance through the sequence of images and stores the centroid information in a file which was discussed above. | 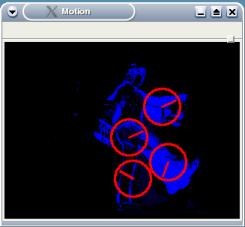 |
|
After the file has been created, the measured target motion and the predicted target
motion can be plotted using Gnuplot with the following command: |
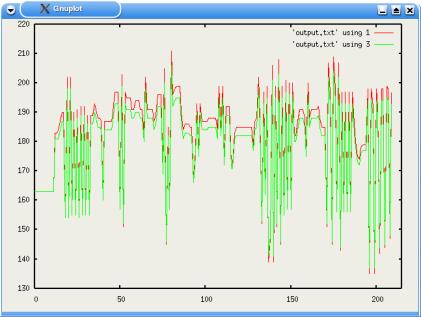 |
The resulting graph is depicted in the image to the left. The red line shows the actual movement, and the green line shows the predicted movement. As you can see, the periodicity is not always perfect - there are pockets in which more than one centroid appear. Currently, I have hardcoded the first position of the predictor to be at the same position of the first centroid, and I do not have a way to distinguish between centroids. Further work will include an algorithm for this, which is discussed below. |
|
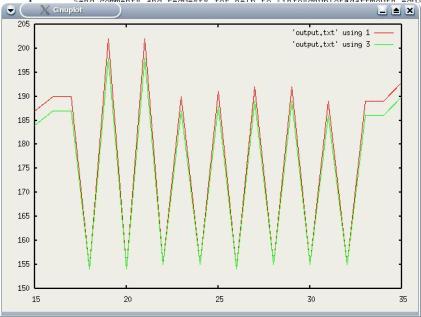
The range of the 'x' coordinate can be set with the following command, in order to focus
in on a specific portion of the graph: > replot |
| This results in the image to the right. As you can
see, the two lines are almost identical, indicating good prediction, as well as
periodicity. This means that the goal has been achieved. |
 |
|
Unsolved Problem The main problem that has yet to be solved is to choose the correct centroid for the cases in which two or more centroids (e.g., moving regions) are shown. One necessary step for achieving this is to calculate the distance between the centroids to make sure that the chosen one is, indeed, the next one in that range of motion. This step was attempted, however the results were incorrect - the value indicating distance occasionally was negative - indicating that I must have an error somewhere in my equation. Upon rechecking of my equation, I think it is correct. |
Andrea Kleinsmith ~ University of Aizu ~ September 8th, 2003
andi@andisplanet.com